8.2a Student Outcomes: Educational Programs
The institution identifies expected outcomes, assesses the extent to which it achieves these outcomes, and provides evidence of seeking improvement based on analysis of the results in the areas below:
- 8.2.a Student learning outcomes for each of its educational programs.
(Student outcomes: educational programs)
√ Compliance ____Non-Compliance
Narrative
St. Petersburg College (SPC) identifies expected student learning outcomes for each of its educational programs, assesses the extent to which it achieves these outcomes, and provides evidence of seeking improvement based on analysis of results.
Note: SPC also offers several clock-hour, workforce programs that can articulate into A.S. degree programs (e.g. Police and Fire Academies), but are not included in this standard as they are not credit-bearing and do not follow credit-bearing degree assessment processes.
Standardization of Overall Assessment Process
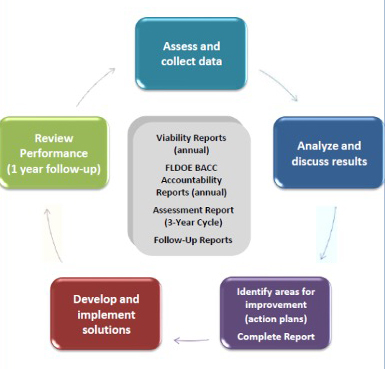
At SPC, institutional effectiveness is the integrated, systematic, explicit, and documented process of measuring performance against SPC’s mission and Strategic Plan for the purpose of continuously improving the College and supporting student success. Developing and measuring effective student learning outcomes is the cornerstone of this continuous improvement process. To accomplish this task, each academic program has established expected program learning outcomes on which it collects and analyzes data to assess the extent to which the program achieves these outcomes and uses the results of the findings to improve programs using the Performance Improvement Cycle.

Figure 1 – Performance Improvement Cycle
SPC is a Florida State College System institution and as such, offers programs in a 2+2 model, including Associate in Arts (A.A.), Associate in Science (A.S.), and Baccalaureate programs. The focus for A.A. degrees is students trasferring to four-year degree programs as opposed to the A.S. and Baccalaureate programs, which are targeted towards students seeking employable skills. All active A.S. and Baccalaureate academic programs participate in the two components of the assessment cycle: annual viability reports and a three-year program assessment, each with follow up reports. The General Education three-year program assessment is used for the A.A. degree program. An active assessment cycle, for any program over a seven-year period, would look similar to the following chart:
Table 8.2a.1 — Assessment Cycle
Follow Up
(including General Education A.A.)
Annual Viability Reports incorporate shorter-term program goals based on viability and performance measures. Program Assessment reports incorporate longer-term program learning outcomes based on the targets of the College’s General Education outcomes, as well as its program-specific outcomes. Together these two processes, while unique by their specific nature, are designed to provide academic leadership and faculty a full view of the success of their programs, uncover areas for improvement, and demonstrate how planned improvements within their action plans support successful student learning.
It is important to note, that by using a three-year assessment cycle, SPC seeks to exceed external accreditation and state requirements, which require a five-year cycle.
Process Roles
Program assessment processes at SPC are collaborative endeavors, with a wide variety of people and departments supporting these processes. Below is a breakdown of these roles:
- Administrative Support – The Institutional Effectiveness (IE) department works in conjunction with several other divisions at the College regarding academic program assessment. Although IE oversees the program assessment at SPC, the contributions and support provided to academic programs by each of the other departments helps define specific elements of the integrated process.
- Institutional Research provides access to a wide variety of data dashboards regarding program vitality and performance metrics.
- Curriculum Services supports student learning outcome alignment within courses and across programs, aids processes for suggested curricular changes that occur from the assessment process, and maintains the course and program outlines of record.
- Instructional Design Education and Support aids with course development and training to faculty, as well as support the ongoing course review process.
- Academic Technology supports student surveys of instruction, as well as online tutorials on various aspects of the teaching and learning process.
- Career Connections provides data and support around Perkins Grant metrics and expectations for all workforce degrees.
- Institutional Effectiveness oversees the assessment process, provides guidance related to efficient assessment methods, as well as reviews the quality of program assessment reports to provide feedback to Deans, Program Leads, and Faculty.
- Academic Deans, Program Leads (previously called Chairs), and Faculty are the key members of the process. They determine the courses and metrics that will assess each program learning outcome, collect the data for the report, and review the results with Institutional Effectiveness to determine changes, if any, that should be made.
- Advisory Boards – Deans, Program Leads and Faculty share the results of the program assessment process with their Advisory Boards to gain insight into workforce needs, currency of program outcomes, and build connections for future student employment.
- Vice President of Academic Affairs reviews final reports and shares results with Cabinet and the President.

SITE MAP
Part I: Signatures Attesting to Integrity
Part II: Institutional Summary Form Prepared for Commission Reviews
Part III: Fifth-Year Compliance Certification
- Section 5: Administration and Organization
- Section 6: Faculty
- 6.1 Full-Time Faculty
- 6.2b Program Faculty
- 6.2c Program Coordination
- Section 8: Student Achievement
- Section 9: Educational Program Structure and Content
- 9.1 Program Content
- 9.2 Program Length
- Section 10: Educational Policies, Procedures, and Practices
- Section 12: Academic and Student Support Services
- 12.1 Student Support Services
- 12.4 Student Complaints
- Section 13: Financial and Physical Resources
- Section 14: Transparency and Institutional Representation
Part IV: Follow-Up Report (not applicable)
Part V: Impact Report of the Quality Enhancement Plan
Supporting Documentation
- SPC Mission, Vision, Values
- Strategic Plan Overview
- Academic Assessment Status
- Bachelor’s Degree Programs Viability Report 2021-22
- Associate Degree Programs Viability Report 2021-22
- Viability Report Checklist
- Institutional Effectiveness Website
- Instruction Guide on Accessing the Educational Outcomes Site
- 2021-22 Environmental Science assessment report
- 2018-19 Environmental Science follow-up report
- 2018-19 Environmental Science assessment report
- 2021-22 Funeral Services Assessment Report
- 2018-19 Funeral Services Follow-up Report
- 2018-19 Funeral Services Assessment Report
- 2022-23 Nursing Assessment Report
- 2017-18 Nursing follow-up report
- 2017-18 Nursing Assessment Report
- 2021-22 Paralegal BAS Assessment Report
- 2017-18 Paralegal BAS Follow-up Report
- 2017-18 Paralegal BAS Assessment Report
- 2022-23 Public Safety Administration Assessment BAS
- 2018-19 Public Safety Administration Follow-up BAS
- 2018-19 Public Safety Administration Assessment BAS
- AAC&U Value Rubrics
- 2021-22 Critical Thinking assessment report
- 2018-19 Critical Thinking follow-up report
- 2018-19 Critical Thinking assessment report
- 2019-20 Global Socio-Cultural (Art appreciation) assessment report
- 2019-20 Global Socio-Cultural (Art appreciation) follow-up report
- 2018-19 Global Socio-Cultural (Art appreciation) assessment report
Assessment of Student Learning Process
As stated, the assessment of the student learning process is comprised of two ongoing processes: annual Academic Program Viability Reports and triannual Program Assessment Reports.
Institutional Effectiveness uses the Educational Outcomes Assessment website (shown below) to manage these assessment processes. This site provides an online database for completing educational assessment reports, aggregating student learning outcomes across educational programs, and establishing a repository for additional program-specific information, such as viability reports, employer surveys, and recent alumni surveys. The site also allows public access (shown below) to all “completed” assessment reports for active programs dating back to 1999. The public nature of the site further encourages the use of assessment data across the College by allowing programs to review completed reports and best practice utilization, not only by their department but from other programs as well. The following program assessment reports are captured by this system: Academic Program Viability Reports (VR), Academic Program Assessment Reports (APAR), and follow-ups to both reports. Currently, the system stores 93 active programs and 56 inactive programs. A quick view of what can be found for academic programs in regard to the assessment reports status can be seen in the academic assessment status document, which is maintained by the IE department.

Figure 2 – Educational Outcomes Website
Academic Program Viability Reports (VR)
Annual Academic Program Viability Reports (VR) are grouped by academic organization, which include all academic degrees and certificates within each degree. Though not specific to program learning outcomes, the VR provides key College stakeholders, such as the President, program advisory boards, Deans, and program administrators with a comprehensive report that summarizes all elements of the program’s viability from a 360-degree perspective. This helps College leadership make critical decisions regarding the continued sustainability of a program and provides program leadership a vehicle to support and document actionable change for the purposes of performance improvement, as well as serves as a way to continuously review key student success metrics.
Most metrics within the VR utilize data from POWER BI and PULSE BI, SPC’s real-time business intelligence systems accessible and verifiable by anyone with login credentials (shown below). The systems filter management and student success data to address questions and identify potential areas for improvement. Measures (such as student course-level success rates) can be viewed at the aggregate institutional level or at the campus or program level.

Figure 3 – Viability Report PowerBI Dashboard
This dynamic system allows Deans and program administrators to gather the necessary data for the reports themselves and to monitor changes to these reports throughout the year to gauge the success of action plan implementations and improve student success. Moreover, 9 filters are available to allow for further data disaggregation, including term, program, plan, college/school/ department, academic organization (default for VR), community, first time in college flag, part/full time. and gender.
The VR includes twelve measures focused on the College’s mission of student success:
total number of student semester hours within the greater academic org, made up of all associated degree/certificates
number of students enrolled in degree/certificate within an academic org and taking courses associated with that degree/certificate, includes ethnic group breakdown
actual enrollment count of the specified Academic Organization divided by the Standard Course Load (SCL) for the selected academic terms.
percent of students completing courses within the academic org with a grade of A, B, or C, divided by the total number of students taking courses within the academic org, and disaggregated by course
separated by degree/certificate, includes ethnic group breakdown
percentage of graduates enlisted in the military, employed, and/or continuing their education within the first year of graduation
average annual job openings
number of students enrolled in clinical, practicum, or internship courses within the program plan during the selected academic years.
number of students in the program plan that have attained an industry certification or have passed a licensing exam
Academic Program Assessment Cycle
Once the program-specific data are pulled, Deans meet with program faculty, program administrators, Career Connections staff, Advisory Committee members, and IE to review statistical trends, create follow-up reports on past year goals, evaluate the impact of the goals on program quality, create the next year’s program-specific goals, identify special resources needed, and note area(s) of concern or improvement. All Viability Reports, upon completion, are printed and reviewed by the Vice President of Academic Affairs and Cabinet. The 2021-22 completed reports can be seen here: Bachelor’s Degree Programs, Associate Degree Programs.
Academic Program Assessment Reports (APAR)
SPC uses academic program assessment reports as a vital tool in achieving its commitment to continuous improvement. General education and program-specific academic assessments are conducted according to a three-year cycle (shown to the right). Although program assessment reports are developed on a three-year cycle, programs are required to collect assessment data on an ongoing basis. SPC’s three-year reporting cycle ensures that assessment reports include multiple data points and that programmatic changes are made based on trends as opposed to a single year. The three-year cycle also allows time for programmatic changes to take effect before the next report is completed. As of 2020-21, any program that reaches the end of its three-year cycle without collecting sufficient data is placed upon an annual cycle until a minimum of three years of data has been collected. This process ensures the integrity of the process, and its intent to support program improvement remains intact.
The Academic Program Assessment Reports consist of the following seven sections:
1) Use of Past Results – captures the effects of previous action plans

Figure 5 – Sample Past Results Language – Business Administration, BS
2) Program Learning Outcomes – lists the program PLOs
Development of Measurable Program Learning Outcomes
The development and assessment of student learning is a systematic, unified process across all programs at SPC. Identified and developed with input from faculty, advisory board members, and program administrators in conjunction with the Curriculum Services Department, SPC Program Learning Outcomes (PLOs) are developed to clearly articulate the knowledge, skills, and abilities of their graduates through demonstratable student learning. PLOs also incorporate general education outcomes, where appropriate, as well as identified best practices in their fields.
Each year, as part of the Annual Viability Report, Institutional Effectiveness (IE) meets with Deans and program faculty to review the Program Learning Outcomes as part of the supplemental Viability Report Checklist. This ensures not only regular review but provides a venue for continuous improvement of these outcomes. For programs that are externally accredited by discipline-specific professional and/or state agencies, programmatic learning outcomes are closely aligned with those established by the accrediting bodies and, in some instances, they are stated verbatim.
The following examples demonstrate PLOs for a baccalaureate program and an A.S. degree program at SPC:
Paralegal Studies B.A.S
- Acquire and implement advanced critical thinking and analytical skills needed to effectively problem-solve.
- Demonstrate the appropriate use of communication and organizational skills within and outside the legal system.
- Execute the technical skills, including legal research and writing, needed to succeed in the legal profession.
- Exhibit the ability to deliver professional and ethical legal services in a culturally and locally appropriate manner.
- Demonstrate an advanced knowledge and understanding of the American legal system.
Environmental Science Technology A.S.
- Scientifically interpret and apply the concepts, principles and theories that constitute aspects of environmental science.
- Evaluate environmental risks and develop plans to address their effects using current methodology and technology.
- Evaluate the role of environmental policies, laws and management practices on the changes in a local ecosystem over a defined period of time.
- Systematically apply field testing and field measurement collection practices in an ecosystem.
Development of General Education Outcomes
SPC’s general education outcomes (shown below) closely align with the State of Florida’s recommended student general education outcomes and are designed to assess broad soft-skill proficiencies attained by students through the general education curriculum, complementary to specific program learning outcomes. As General Education courses are a part of all academic programs at SPC, IE staff, faculty, and program administrators review the general education curriculum to produce assessment measures that provide evidence that the courses and curriculum meet institutional goals for student learning. General Education Outcomes are reviewed as part of the 3-year assessment cycle.
SPC General Education Outcomes
- Critical Thinking: Analyze, synthesize, reflect upon, and apply information to solve problems, and make decisions logically, ethically, and creatively.
- Communication: Listen, speak, read, and write effectively.
- Scientific and Quantitative Reasoning: Understand and apply mathematical and scientific principles and methods.
- Information and Technology Fluency: Find, evaluate, organize, and use information using a variety of current technologies and other resources.
- Global Socio-Cultural Responsibility: Participate actively as informed and ethically responsible citizens in social, cultural, global, and environmental matters.
3) Assessment Methodology – defined per PLO
The assessment methodology section describes the means by which each PLO is being assessed, using a multiple methods approach that includes direct and indirect metrics. Direct metrics provide quantitative data and may include course examinations, assignments, capstone projects, and industry certification exams. A minimum of one direct metric is required to assess each PLO. Quantitative data provides evidence to ensure the knowledge and skills necessary to address the PLO were met. Indirect metrics provide qualitative data and are collected through the administration of institutional and national student surveys, at specific points throughout their tenure at SPC. The section also describes the timeline and population associated with the data collected; the instrument used to collect quantitative and qualitative data, and rubric utilized.

Example Methodology Language – Business Administration, BS
4) Criteria for Success – defined per PLO
The Criteria for Success section specifies the evaluation standards or benchmarks by for each metric used to assess a PLO, and determines to what extent each metric was successfully met.

Example Criteria for Success Language – Business Administration, BS
5) Summary of Assessment Findings – defined per PLO
The Summary of Assessment Findings section displays the actual data collected, the number of students assessed, and whether the criteria for success were met, for each metric listed in the Methodology section, for each PLO. Data are provided by semester or annually and are disaggregated by delivery modality (face-to-face, online).


Example Assessment Findings Language – Business Administration, BS
6) Discussion and Analysis – defined per PLO.
This section details the comparison between the current year’s assessment results and the established thresholds set in the criteria of success section of the document. This information is used to drive change and improvement in the program by highlighting the learning outcome areas that do not meet established thresholds and establishing appropriate action plans.

Example Discussion and Analysis: Business Administration, BS
7) Action Plan and Timeline – defined per PLO and includes budgetary and planning implications.
The action plan and timeline section is created by the program administrator to address any issues identified in the assessment findings and drive program improvement.

Example Action Plan and Timeline: Physical Therapist Assistant, AS
In the year following an APAR, program administrators submit a follow-up report to ensure that identified changes from the action plans are implemented and will be measured in the subsequent reports. For programs that meet their goals or report no findings, an action plan will be implemented to review criteria and determine what/if new goals or targets are appropriate. This supports a continuous improvement process of review and refinement.

Example action plan follow-up items: Physical Therapist Assistant, AS
Examples of Academic Program Assessment Reports
Access to all Academic Program Assessment Reports is available to the public on the Educational Outcomes website, found on the Institutional Effectiveness website (see Instruction Guide). Due to the ease of public access to all assessment reports, the College is not providing sampling, but to ease review, below are some examples including off-cycle assessments that have been placed on annual review.
Environmental Science A.S
- 2021-22 Environmental Science assessment report;
- 2018-19 Environmental Science follow-up report;
- 2018-19 Environmental Science assessment report
Funeral Services A.S.
- 2021-22 Funeral Services Assessment Report;
- 2018-19 Funeral Services Follow-up Report;
- 2018-19 Funeral Services Assessment Report
Nursing A.S. (off-cycle)
- 2022-23 Nursing Assessment Report;
- 2017-18 Nursing follow-up report;
- 2017-18 Nursing Assessment Report
Paralegal B.A.S (off-cycle)
- 2021-22 Paralegal BAS Assessment Report;
- 2017-18 Paralegal BAS Follow-up Report;
- 2017-18 Paralegal BAS Assessment Report
Public Safety B.A.S. (off-cycle)
General Education Assessment
In addition to the programmatic assessment process described above, the APAR captures the general education outcomes assessment process and follows the same format. Broken down by each General Education area, each report uses a wide variety of methods to assess overall student learning, including survey data, exam data, and course assessments. Within the Use of Past Results section, trend data is included to allow Deans, Program Administrators, and Faculty to provide greater insight on the impact of their action plans.
Association of American Colleges and Universities (AAC&U) Value Rubrics have been utilized to enhance the general education assessment process at SPC since 2015. The inclusion of these Value Rubrics allows faculty to evaluate the quality of the general education curriculum and identify areas for performance improvement, based on globally accepted discipline-specific rubric categories.
In 2015, IE assisted Deans and faculty to review student competencies in the areas of Critical Thinking, Ethics, Mathematics, and Humanities/Fine Arts. Student competencies were then compared to various AAC&U Value Rubrics for alignment. Ultimately each discipline selected the rubric which best aligned to the respective student competencies and designed PLOs and assessments to incorporate those best practices.
Example: Mathematics–Scientific and Quantitative Reasoning
The Mathematics Department selected a revised version of AAC&U’s Quantitative Literacy VALUE Rubric to assess Mathematics student competencies within SPC’s Scientific and Quantitative Reasoning general education outcome. Elementary Statistics STA 2023 was chosen as the course that best aligns with all six competencies. Questions from the common online midterm exam were mapped to the appropriate competency. Instructors teach the course focusing on state and department mandated course objectives. Students are assessed automatically when they take the online midterm. Data is gathered at the end of each semester and analyzed by the Mathematics Dean and faculty and reported under the program learning outcome. The process was designed to allow for a non-interruptive and efficient way to assess students.
Example: Humanities and Fine Arts–Global Socio-Cultural Responsibility
The Humanities/Fine Arts department selected a revised version of the AAC&U Global Learning VALUE Rubric to assess student competencies in social, cultural, and global matters, within SPC’s Global Socio-Cultural Responsibility general education outcome. The focus is on various topics, relationships, and themes of human expression from a global perspective. Instructors design and grade individual assignments using a modified version of the Global VALUE Rubric as an additional competency measure. The revised Global VALUE Rubric data are gathered at the end of each semester and analyzed during the Global Socio-Cultural Responsibility assessment processes. The assignment requires students to incorporate theoretical concepts and vocabulary into an essay. The rubric focuses on students’ knowledge of aesthetics and cultural expressions of both Western and non-Western origins.
Results from these assessment activities are reported on the general education program assessment reports.
Examples of General Education Assessment Reports
Access to all General Education Assessment Reports is available to the public on the Educational Outcomes website, found on the Institutional Effectiveness website. Due to the ease of public access to all assessment reports, the College is not providing sampling, but instead to ease review below are some examples, including off-cycle assessments, representing areas that have been placed on annual review.
Critical Thinking
- 2021-22 Critical Thinking assessment report;
- 2018-19 Critical Thinking follow-up report;
- 2018-19 Critical Thinking assessment report
Global Socio-Cultural Responsibility (off-cycle) (Note: the assessment and follow up were completed simultaneously due to significant rubric changes that caused the assessment focus to change.)
Use of Results to Drive Institutional and Program Improvement
Each of the two components of the assessment cycle, viability reports (VR) and three-year program assessment, as well as their associated follow-up reports, include specific goals and action plans focused on making programmatic improvements based upon the results being analyzed. Below are several examples of action plans and/or follow-up reports that track these desired and implemented improvements.

Example 1 – 2020-2021 Viability Report Action Plan for Biomedical Engineering Technology A.S.

Example 2 – 2020-2021 Assessment Report Action Plan for Physical Therapist Assistant A.S.

Example 3 – 2021-22 Assessment Report Action Plan Follow-Up for Physical Therapist Assistant A.S.
Within the Action Plan Follow-Up reports, the final section requires an explanation about the intended future impact of the change being made on program quality. These explanations are used to determine next steps in future assessment planning.

Example 4 – 2020-21 Assessment Report Action Plan Follow-Up Report for Computer Programming and Analysis A.S.
General Education Assessment Reports, like program assessment reports, also include action plans and follow-up reports, as demonstrated by the example below from the Global Socio-Cultural Responsibility–Effective Citizenship Follow-Up report.

Example 5 – 2022 General Education Assessment Follow-Up Report for Global Socio-Cultural Responsibility-Effective Citizenship
Depending on the analysis of the data, action plans created during the APAR process can focus on a variety of improvements: curricular changes, assessments used, course or assignment revisions, etc. To support the implementation of these proposed changes, the Dean and Faculty can reach out to a variety of academic and student support departments. Action plans that align to the Enhance Curriculum category—such as course additions/deletions, course content, and pre-requisite/co-requisite revisions—are completed with assistance from the Curriculum Services department and/or Instruction, Design, Education and Support department. Action plans that require Faculty Professional Development are completed with assistance from the Center for Excellence in Teaching and Learning. Action plans aligned to the Assessment Methodology category, such as revising the assessment plan; data collection and analyses; and assessment instruments are completed with assistance from the Institutional Effectiveness department. Generic action items that align with the overall Student Success category are completed with assistance from any of the aforementioned departments as well as other collegewide teams of faculty and administrators.
Review and Approval Process
Academic Program Assessment Reports and General Education assessment reports undergo an extensive review and approval process to ensure quality and provide feedback to the program before the report is published. Program administrators submit completed assessment reports within the Educational Outcomes website where they are reviewed by IE staff, the associated Academic Dean, and the Associate Vice President for Institutional Effectiveness and Academic Services and/or the Vice President of Academic Affairs in succession. Assessment reports are approved and continue through the approval chain or are returned to the program administrator for revision. This process ensures that assessment results are communicated and reviewed by key stakeholders at each level of the institution.

Example Approval Chain: Computer Information Technology-AS
Distance Education and Dual Enrollment Assessment of Program Learning Outcomes
All academic programs, regardless of modality, follow the same assessment process.
The Academic Program Assessment Report (APAR) process addresses learning outcome attainment for distance education. Academic programs have historically identified course(s) where students demonstrate attainment of program learning outcomes. The Summary of Assessment Findings section within the APAR is subdivided to allow academic programs to disaggregate outcome data between face-to-face and distance learning instruction. Several academic programs offer instruction via a single modality. For selected courses that include both traditional lecture and distance learning sections, assessment data are disaggregated by modality. Deans and faculty can then review disaggregated results to determine whether there are differences in student learning outcomes and address any differences in a follow-up action plan.
Like distance education students, Dual Enrolled students are assessed together with all other students in their program. However, APARs do not disaggregate data based on Dual Enrolled student status.
Table 8.2a.2 — Business Administration-AS Disaggregated Data by Modality 2018-2019
SWOT Analysis
Mgmt skills vs traits
Key Lime Case
