8.1 Student Achievement
√ Compliance ____Non-Compliance
Narrative
St. Petersburg College (SPC or the College) identifies, evaluates, and publishes goals and outcomes for student achievement appropriate to the institution’s mission, the nature of the students it serves, and the kinds of programs offered. SPC uses multiple measures to document student success, all of which are published on its Student Achievement website.
SPC’s student population (p.3) is primarily older (over 22), the majority of whom are female and are seeking either a transfer AA degree or a workforce focused AS degree. The College has chosen the following eight metrics to provide a broad and holistic overview of student success:
- Graduation Rates
- 6-Year Completion Rate
- 3-Year Completion Rate
- Course Success Rate
- Progression
- Fall to Fall Retention Rate
- Fall to Spring Persistence
- Spring to Fall Persistence
- Fall to Fall Retention Rate
- AA Transfer and Continuing Education Rate
- Job Placement Rate and Earnings
These eight measures support the primary functions of a 2+2 (two-year associate with secondary admission to upper division baccalaureate), open-access institution in the Florida College System and align to state performance funding metrics as well as the College’s strategic plan and mission. Florida State Board of Education Administrative Rule 6A-14.07621 delineates the following measures as part of the performance-based incentive program for the 28 Florida College System institutions: retention, completion, postgraduation employment, continuing education rate, and completer entry-level wages. The College’s current strategic plan measures progress on closing achievement gaps for retention, completion, and course success, as well as employment and continuing education rates. The College’s mission emphasizes student success, economic mobility, and academic excellence. The next iteration of the College’s strategic plan will be focusing on post-graduation success as well, thus the inclusion of transfer and continuing education metrics to the current focus of employment and wages. The chart below delineates the alignment between the measures chosen and the mission’s three foundational elements.
Table 8.1.1 — Alignment of Student Achievement Metrics
By using measures that align with these three foundational elements, College leadership is able to assess student achievement from various points during a student’s academic pathway and ensure current practices support increasing gains.
Graduation Rates
St. Petersburg College utilizes two graduation measures to better understand student completion: the National Clearinghouse 6-year completion rate and an internal 3-year completion rate.
National Student Clearinghouse 6-Year Completion Rate
In 2018, the College chose to utilize the National Student Clearinghouse (NSC) 6-year completion rate as it provides the most comprehensive depiction of student completions for our student body. The NSC rate captures both full and part-time students entering for the first time in the fall semester of that year and graduating within 6 years, and it incorporates student completions after transfer, not just completions that occurred at SPC. These parameters best support the myriad of ways students at SPC start and complete their academic pathway, including providing time to stop-out and re-enter their path.
SITE MAP
Part I: Signatures Attesting to Integrity
Part II: Institutional Summary Form Prepared for Commission Reviews
Part III: Fifth-Year Compliance Certification
- Section 5: Administration and Organization
- Section 6: Faculty
- 6.1 Full-Time Faculty
- 6.2b Program Faculty
- 6.2c Program Coordination
- Section 8: Student Achievement
- Section 9: Educational Program Structure and Content
- 9.1 Program Content
- 9.2 Program Length
- Section 10: Educational Policies, Procedures, and Practices
- Section 12: Academic and Student Support Services
- 12.1 Student Support Services
- 12.4 Student Complaints
- Section 13: Financial and Physical Resources
- Section 14: Transparency and Institutional Representation
Part IV: Follow-Up Report (not applicable)
Part V: Impact Report of the Quality Enhancement Plan
Supporting Documentation
- Student Achievement website
- SPC Student Population (Factbook) p.3
- FL State Board of Education Administrative Rule 6A-14.07621
- SPC Strategic Plan Measures
- College Mission
- African American Male Taskforce
- Brother to Brother
- Learning Resource Center
- Faculty Guide to Student Services
- 2021 FETPIP AA Outcomes
- Unlocking Opportunities Initiative
- Florida Statute 1001.60
- Career Source Pinellas
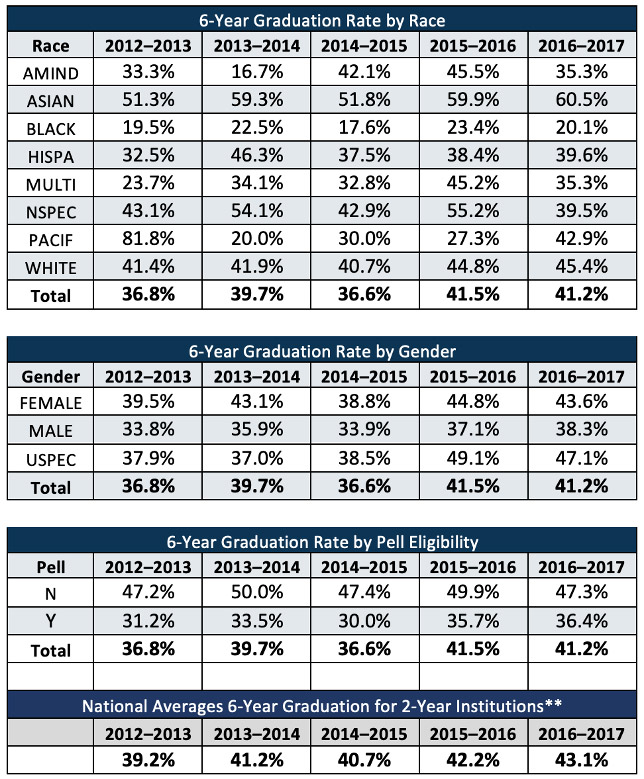
SPC compares its graduation rates to the national average to ensure the College is providing an equitable experience for our students and to align to a national benchmark to strive for and eventually exceed. Over the past 5 years, the national average has increased by 3.9%, whereas SPC graduation rates have increased by 4.4%, showing the work the College has done to close the gap. While our overall goal is to meet and then exceed national benchmarks, the College has used its own data trends to determine year-to-year thresholds and goals to make incremental increases in an effort to close the gap. Therefore, it has set the Threshold of Acceptability as the lowest rate within the past five-year’s trend (36.6%) and its Goal Target (41.5%) is to at least meet the highest rate within that five-year trend.
- Threshold of Acceptability: 36.6%
- Goal Target: 41.5%
- Achievement: 41.2%
Table 8.1.2 — NSC 6-Year Completion Rates for St. Petersburg College Graduates
*Source: National Student Clearinghouse 6-year completion rates
** Source: National Student Clearinghouse November 2022 report
SPC has made continual, incremental progress in increasing its completion rates as shown by the data table above, except for the 2014-15 cohort, which was impacted by the COVID-19 pandemic. The College is intentional in using data to make necessary improvements, and completion measures have contributed to key components of the last two strategic plans. Early disaggregation of the data identified that our Black students, especially male and economically disadvantaged students, were the target group for improvement. An African-American Male task force was assembled, who then created several initiatives that supported these gains. First, each semester all first-time-in-college students in this demographic are assigned a faculty/staff mentor, who serves as a college point of contact and success coach. Second, our Brother-to-Brother community was reinstated, which provides a wraparound system of support, mentoring, and forms of engagement that encourage academic achievement. In addition, Learning Resource Center staff collaborated with Online Learning Services and Student Services to identify these students on the class rosters and provide a link to the many resources available to support their success (see Faculty Guide to Student Services), and cultural competency training was provided to all faculty and staff by our Center for Teaching and Learning, as well as serving as a topic for our Summer 2021 Summer Institute professional development for faculty and staff. By having a laser focus on helping one particular group increase, the overall completion rates of the College have made incremental progress.
Internal 3-Year Graduation Rate
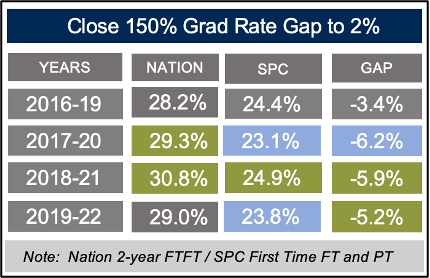
As part of the College’s initiative to increase graduation rates, it also looks closely at its internal 150%, or 3-year completion rate, for both full or part-time students enrolling in Fall for the first time in any Associate’s degree or certificate program. Whereas traditional 3-year completion rates focus solely on full-time enrolled students, SPC chose to look at both full and part-time students for two reasons. First, the College’s student population is primarily part-time (72%) and excluding that large portion of the student body would not reveal accurate improvements. Second, when looking at national comparisons, SPC’s first-time, full-time completion rate (42.8% five-year average) was much higher than the national average based on just first-time, full-time students (28.9% five-year average). Thus, including both full and part-time students would better tell the accurate data story.
The internal graduation measure was included as part of the most recent strategic plan with a goal to close the gap between SPC’s first-time, full and part-time completion rate and the national first-time, full-time completion rate to 2% (Table 8.1.2). This goal was set prior to the COVID pandemic, and results show that the pandemic negatively impacted student time to completion (2017-20 cohort), but the gap has begun to decrease again.
Table 8.1.3 — SPC Strategic Plan Internal 3-Year Completion Metric
Source: St. Petersburg Student Database/PeopleSoft and National Center for Educational Statistics
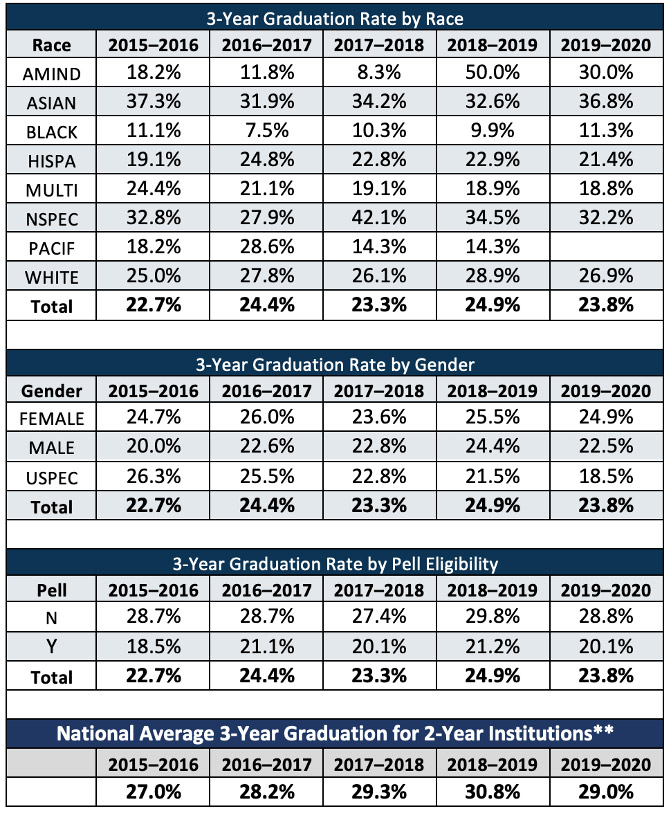
As the goal is to close the gap between the SPC 3-year graduation rate and the National 3-year graduation rate to 2%, the College set the Threshold of Acceptability as the lowest rate within the 5-year trend (22.7%) and its Goal Target (24.9%) to at least meet the highest rate within that 5-year trend, with an intent to continue to increase the rate each year to meet the national rate.
- Threshold of Acceptability: 22.7%
- Goal Target: 24.9%
- Achievement: 23.8%
Table 8.1.4 — Internal 3-Year Graduation Rates for St. Petersburg College
*Source: St. Petersburg Student Database/Peoplesoft
** Source: National Student Clearinghouse November 2022 report
Note: In 2019-20, there were no Pacific Islander graduates.
Course Success Rate
St. Petersburg College tracks course success rates as a measure of student achievement and progression through their academic pathway. SPC defines course success as the number of A, B, and C grades divided by all possible grades for a given period of time.
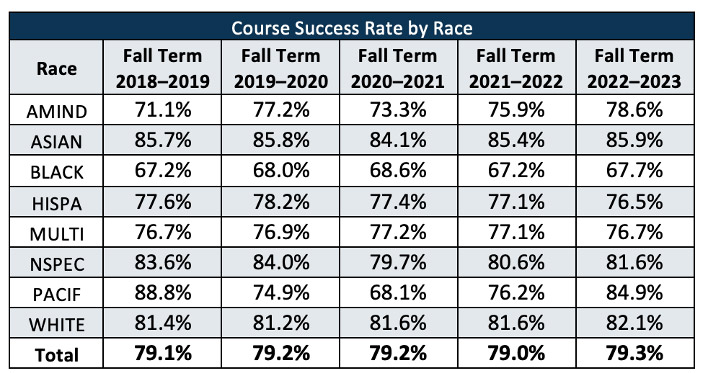
As this is entirely an internal achievement metric, SPC uses its own trend data to determine the parameters for success. For the past several years, the College has had a goal of achieving 80% course success, and thus maintained this as its Goal Target. For its Threshold of Acceptability, it again chose the lowest rate within the 5-year trend as a baseline (79.0%).
- Threshold of Acceptability: 79.0%
- Goal Target: 80.0%
- Achievement: 79.3%
Table 8.1.5 — Course Success Rates
*Source: St. Petersburg Student Database/Peoplesoft
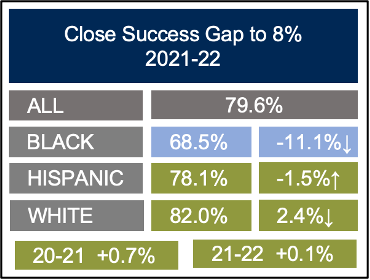
As part of the completion efforts discussed above, the data review identified that focusing on increasing course success for our lowest demographic group, Black students, would have the greatest impact on the overall course success rate. As such, strategic plan (2020-24) efforts included closing the gap between overall College average course success rates and those of our black students to 8% as a key metric; the College utilized the African American Male Taskforce initiatives started in Fall 2019 to support this goal. The success of these efforts can be seen in the two Fall semesters prior to and at the beginning of the pandemic (Fall 2019 and Fall 2020), then dipping in Fall 2021 (and overall for 2021-22, Table 8.1.5) likely due to the adjustment of returning to back to campus, before beginning to rebound in Fall 2022. Spring 2023 was the first term to rebound and hit the Goal Target with an 80.9% course success rate for Black students.
Table 8.1.6 — Strategic Plan Metric Course Success
*Source: St. Petersburg Student Database/Peoplesoft
Note: Bottom metrics for 2020-21 and 2021-22 note overall annual increases in Course Success Rates
Progression
Progression is a key metric when focusing on improving time to degree and graduation rates, which is a focus at SPC. As such, the College uses two achievement measures to determine student progression: the industry standard of Fall-to-Fall retention rate reflecting students who continue enrollment in the subsequent year and the related Term-to-Term persistence rates, reflecting students who continue enrollment in the subsequent Fall or Spring term.
Retention
Whereas most national metrics focus on first-time, Fall-entering students, SPC has chosen to look at retention from a more holistic level and includes all enrolled students during a given Fall who return the following Fall, excluding those who graduate. However, from a comparison standpoint to national averages, the National Center for Educational Statistics for 2022 notes that the five-year average for first-time retention rates for 2-year public institutions is 61.6%. SPC’s five-year average for first-time students is 59.1%.
Persistence
Similarly, SPC looks at persistence holistically in that it includes all enrolled students who return the subsequent term, excluding the Summer term and those who graduate within the given term.
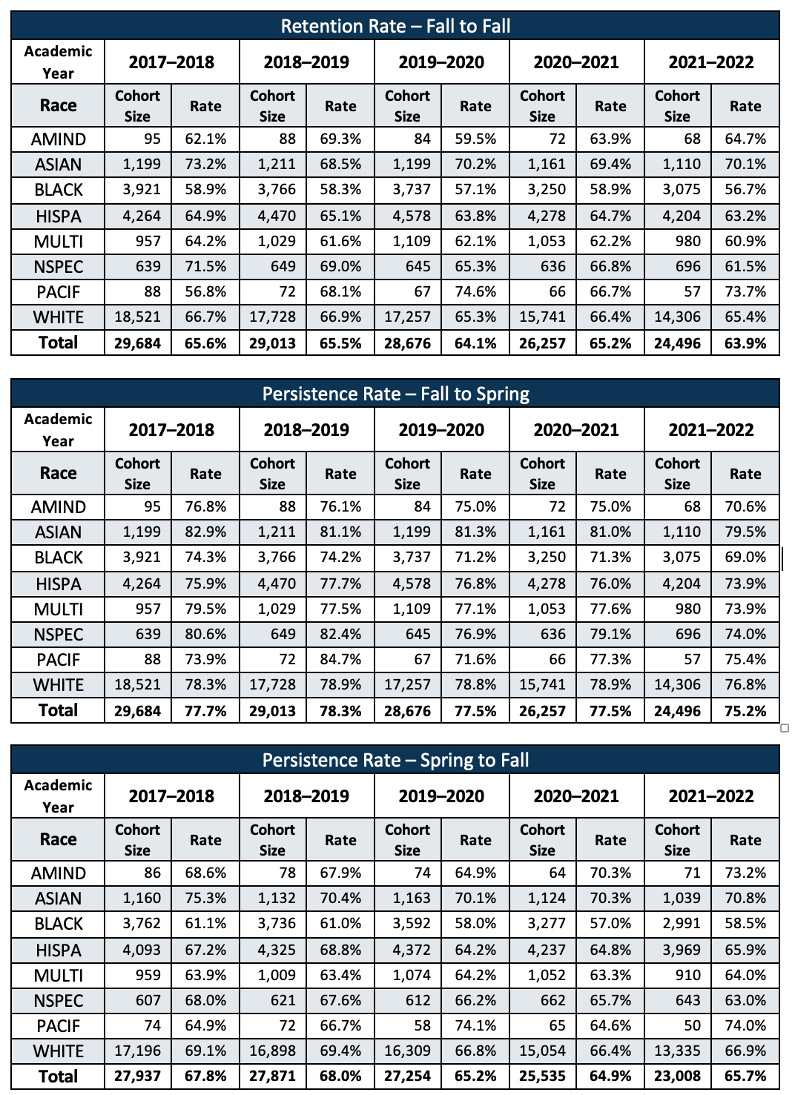
In order to set the benchmarks for the Progression metric, SPC used its 5-year retention trend data (Table 8.1.7) to identify the lowest rate as the Threshold of Acceptability (75.2%), and the highest rate as its Goal Target (78.3%). Note that Thresholds and Goals are not set for the persistence data as it serves as supporting data to the retention data, allowing College leadership to determine where gain and losses are occurring during the year.
- Threshold of Acceptability: 75.2%
- Goal Target: 78.3%
- Achievement: 75.2%
Table 8.1.7 — Progression Measures – Retention and Persistence at St. Petersburg College
*Source: St. Petersburg Student Database/Peoplesoft
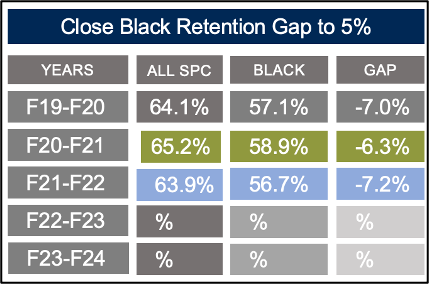
Overall enrollment trends have been decreasing at SPC over the past decade, and the retention rate has also decreased, which increases the need to focus on this metric, especially for those demographics with the lowest rates– our black students. As part of the current strategic plan, the College included closing the retention rate gap between the College’s average and that of our Black students to 5% as a key metric and created several initiatives discussed earlier to support this goal.
Table 8.1.8 — Strategic Plan Metric Retention
*Source: St. Petersburg Student Database/Peoplesoft
Although we were making some headway in closing the gap following the pandemic, as with all of our measures, the 2021-22 academic year was a difficult one for students, especially for our lowest-performing student population, our Black students. An early retention data pull in September 2022 (for our academic program viability reports) showed that our Black students had a 58.2% retention rate for Fall 21-Fall 22 which equated to a -6.0% gap. However, by the end of Fall of 2022, that rate had decreased to 56.7% and increased the gap to -7.2%. A deeper dive into the data showed a 1% increase in the percentage of term withdrawals for this student group even though a greater percentage took face-to-face classes, usually their more successful modality (Table 8.1.9).
Table 8.1.9 — Black Student Enrollment Trends for 2021-22

*Source: St. Petersburg Student Database/PowerBI Enrollment Trent Dashboard
SPC’s 2021-22 academic year was our first year of reinstating a full return to campus campaign and increasing our face-to-face classes to pre-pandemic levels. Conversations with faculty and advisors ascertained that students struggled with the additional time commitments coming to campus created in their life, thus possibly identifying one reason that Black students’ metrics fell.
AA Transfer and Continuing Education Rates
St. Petersburg College has 44%, of its students seeking an Associate of Arts (AA) degree. As such, the College has invested time and effort to create transfer advisement pathways with its closest University partners and internally with our own Baccalaureate programs. Therefore, the rate of continuing education among AA graduates, who continue further in their academic pathway to receive a Bachelor’s degree at St. Petersburg College or another institution, is another key measure of student achievement.
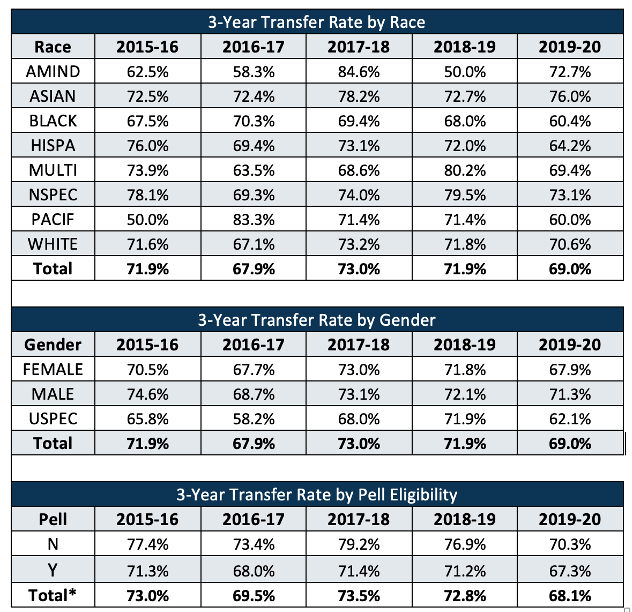
For this measure, the data tracks any student graduating with an AA in the identified year in Table 8.1.10, who then transferred to continue their education at any institution within 3 years. The three-year period was chosen to align with a 150% time to completion metric, thinking that most students would likely transfer by then. We did run a 6-year transfer rate as a quick comparison and found that the increase was only 3% more. For the Threshold of Acceptability, the College chose the lowest percentage over the 5-year span (67.9%) and for the Goal Target, we chose the highest percentage (73.0%).
- Threshold of Acceptability: 67.9%
- Goal Target: 73.0%
- Achievement: 69.0%
Table 8.1.10 — AA Transfer and Continuing Education at St. Petersburg College
*Source: National Student Clearinghouse Research Center
NOTE: Pell Eligibility totals do not include students whose eligibility was unknown or who did not submit a FAFSA
As a point of comparison, the Florida Education and Training Placement Information Program (FETPIP) provided annual data on completions, employment, and continuing education (see the latest 2021 FETPIP AA Outcomes data provided for AA graduates) that compares each institution in the Florida College System. St. Petersburg College ranks in the 5th highest bracket with at 67% continuing education rate, the same as the State average. As part of the College’s next step in its Pathways work, it has been chosen to participate in the Aspen Institute and Community College Research Center’s Unlocking Opportunities Initiative, where we will be looking deeper into our transfer data to ensure that when students transfer to a baccalaureate program, the program will lead to mid to high-wage jobs.
Job Placement and Earnings
The final measure of student achievement that St. Petersburg College reviews is the job placement and earnings for our Associate in Science (AS) and Baccalaureate graduates. Per Florida Statute 1001.60, all institutions in the Florida College System are designed to respond to community needs for postsecondary academic education and career degree education and provide associate and baccalaureate degrees that will best meet the state’s employment needs. As such, the Florida Department of Education uses job placement and earnings in their Career Technical Education (CTE) audits and as part of the performance funding model. In addition, SPC’s new work with the Unlocking Opportunities initiative looks closely at post-graduation outcomes in regard to job placement, specifically into mid to high-wage jobs.
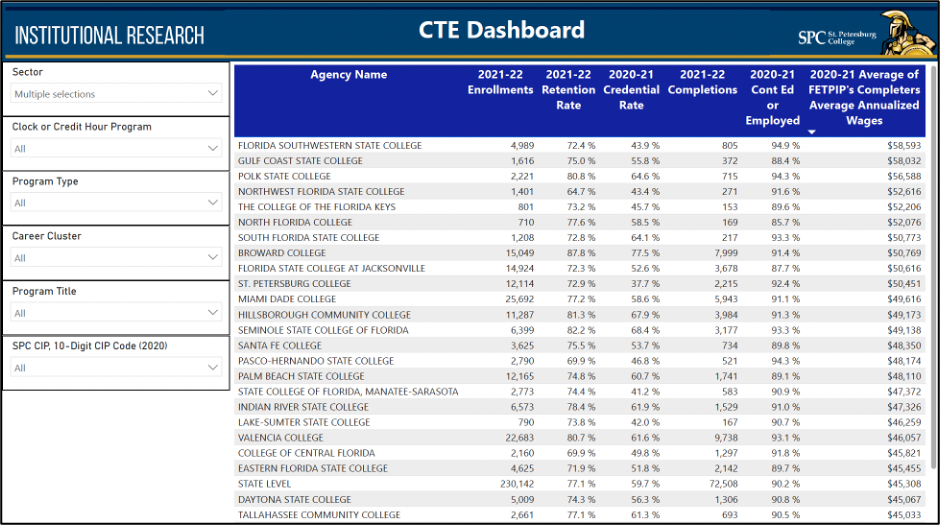
The 2021-22 CTE audit data places SPC 10th for overall wages of $50,451 for AS degrees, certificate programs and clock-hour programs (Table 8.1.11).
Table 8.1.11 — 2021-22 CTE Audit Data
*Source: State of Florida CTE Audit Database
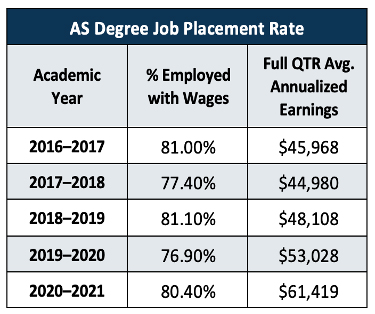
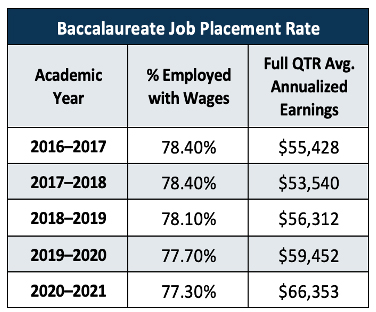
The Florida College System uses data provided by FETPIP to determine graduate placement rates and average wages. SPC used the same methodology to set the Thresholds of Acceptability, using the lowest percentage of the 5-year trend, and the Goal Target, using the highest percentage of the 5-year trend to track incremental changes each year within those boundaries. On average, 79.4% of AS degree graduates and 78.0% of Baccalaureate graduates are found to be employed earning wages. While there is still discussion at the state level around state-level goals, SPC uses the local mean wage for high skill/high wages identified by CareerSource Pinellas of $26.19/hr, which equates to $54,475.20 annually, as the goal wage for graduates.
Table 8.1.12 — Job Placement and Earnings
AS Degree Job Placement
- Threshold of Acceptability: 76.9%
- Goal Target: 81.1%
- Achievement: 80.4%
*Source: Florida Department of Education FETPIP reports for Florida College System
Baccalaureate Job Placement
- Threshold of Acceptability: 77.3%
- Goal Target: 78.4%
- Achievement: 77.3%
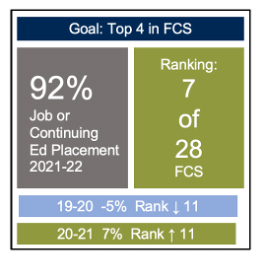
Combining the transfer rate and the job placement rate, FETPIP also provides a Job or Continuing Education Placement rate, which the College used in its latest strategic plan. A goal was set for AS degree graduate placement rate to rank SPC as 4th in the Florida College System. It is currently ranked 7th and has fluctuated up and down over the past two years.
Table 8.1.13 — Strategic Plan Metric for Economic Mobility
*Source: Florida Department of Education FETPIP reports for Florida College System
As the College begins to develop its next strategic plan during the 2023-24 academic year, it is expected that a higher focus will be placed on these last two post-graduation metrics to align with its Pathways work and meet set goal targets, along with continuing to focus on completion.

